Python datatable is the newest package for data manipulation and analysis in Python. It carries the spirit of R's `data.table` with similar syntax. It is super fast, much faster than pandas and has the ability to work with out-of-memory data.
Python datatable is the newest package for data manipulation and analysis in Python. It carries the spirit of R’s data.table with similar syntax. It is super fast, much faster than pandas and has the ability to work with out-of-memory data. Looking at the performance it is on path to become a must-use package for data manipulation in python.
101 Python datatable Exercises (pydatatable). Photo by Jet Kim.
1. How to import datatable package and check the version?
Difficulty Level: L1
Show Solution
python
import datatable as dt
dt.__version__
python
'0.8.0'
You need to import datatable as dt for the rest of the codes in this exercise to work.
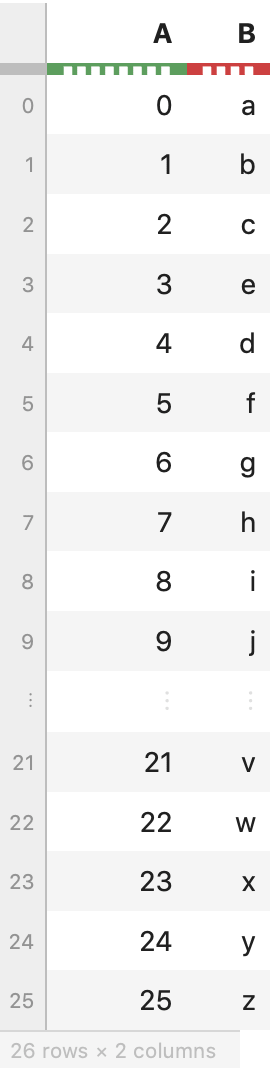
2. How to create a datatable Frame from a list, numpy array, pandas dataframe?
Difficulty Level: L1
Question: Create a datatable Frame from a list, numpy array and pandas dataframe.
Input:
python
import pandas as pd
import numpy as np

my_list = list('abcedfghijklmnopqrstuvwxyz')
my_arr = np.arange(26)
my_df = pd.DataFrame(dict(col1=my_list, col2=my_arr))
# Solution: Use csv reader. Unfortunately there isn't an option to do it directly using fread()
import datatable as dt
import csv
with open('local/path/to/BostonHousing.csv', 'r') as f:
reader = csv.reader(f)
for i, row in enumerate(reader):
row = [[x] for x in row]
# 1st row
if i == 0:
df = dt.Frame(row)
header = [x[0] for x in df[0,:].to_list()]
df.names = header
del df[0,:]
# Every 50th row
elif i%50 ==0:
df_temp = dt.Frame(row)
df_temp.names = header
df.rbind(df_temp)
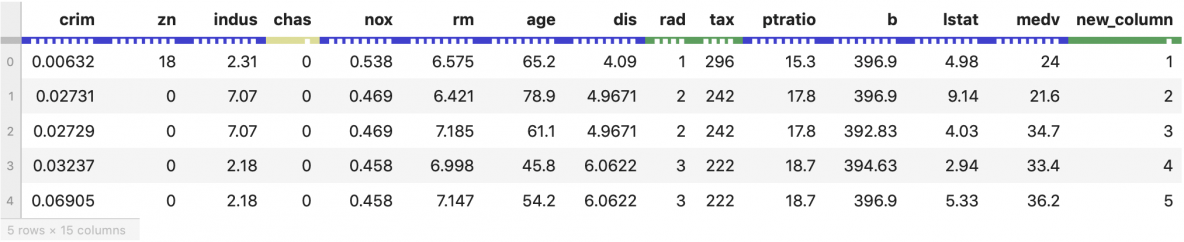
df.head(5)
11. How to change column values when importing csv to a Python datatable Frame?
Difficulty Level: L2
Question: Import the boston housing dataset, but while importing change the 'medv' (median house value) column so that values < 25 becomes ‘Low’ and > 25 becomes ‘High’.
# Solution: Use csv reader
import datatable as dt
import csv
with open('https://raw.githubusercontent.com/selva86/datasets/master/BostonHousing.csv', 'r') as f:
    reader = csv.reader(f)
    for i, row in enumerate(reader):
        row = [[x] for x in row]
        if i == 0:
            df = dt.Frame(row)
            header = [x[0] for x in df[0,:].to_list()]
            df.names =  header
            del df[0,:]
        else:
            row[13] = ['High'] if float(row[13][0]) > 25 else ['Low']
            df_temp = dt.Frame(row)
            df_temp.names = header
            df.rbind(df_temp)

df.head(5)
12. How to change value at particular row and column in a Python datatable Frame?
Difficulty Level: L1
Question: Change value at row number 2 and column number 1 as 5 in a datatable Frame.
# Solution: It follows row, column indexing. No need to use "loc", ".loc"
import datatable as dt
df = dt.fread('https://raw.githubusercontent.com/selva86/datasets/master/BostonHousing.csv')
df[2,1] = 5
df.head(5)
13. How to delete specific cell, row, column, row per condition in a datatable Frame?
# Solution: It follows row,colume indexing. No need to use "loc", ".loc"
import datatable as dt
df = dt.fread('https://raw.githubusercontent.com/selva86/datasets/master/BostonHousing.csv')

# Delete the cell at position `2,1`.
del df[2,1]

# Delete the `3rd` row.
del df[3,:]

# Delete the `chas` column.
del df[:,"chas"]

# Delete rows where column `zn` is having 0 value.
del df[dt.f.zn == 0,:]

df.head(5)
14. How to convert datatable Frame to pandas, numpy, dictionary, list, tuples, csv files?
# Solution
import datatable as dt
df = dt.fread('https://raw.githubusercontent.com/selva86/datasets/master/BostonHousing.csv')
for i in range(len(df.names)):
    print(df.names[i], ":", df.stypes[i])
# Input
import datatable as dt
df = dt.fread('https://raw.githubusercontent.com/selva86/datasets/master/Cars93_miss.csv')

# Solution
old_col_name = "Model"
new_col_name = "Car Model"
df.names = [new_col_name if x == old_col_name else x for x in df.names]
df.head(5)
25. How to count NA values in every column of a datatable Frame?
Difficulty Level: L1
Question: Count NA values in every column of a datatable Frame.
# Solution
import datatable as dt
df = dt.Frame(random=np.random.random(4)**10)
df[:,"random2"] = dt.Frame(['%.6f' % x for x in df[:,"random"].to_list()[0]])
df
29. How to filter every nth row in a pydatatable?
Difficulty Level: L1
Question: From df, filter the 'Manufacturer', 'Model' and 'Type' for every 20th row starting from 1st (row 0).
# Input
import datatable as dt
df = dt.fread("https://raw.githubusercontent.com/selva86/datasets/master/BostonHousing.csv")

# Solution
for i in range(len(df.names)):
    if df.sum()[0:1,:].to_list()[i] == max(df.sum()[0:1,:].to_list()):
        print(df.names[i])
python
tax
32. How to normalize all columns in a dataframe?
Difficulty Level: L2
Questions:
Normalize all columns of df by subtracting the column mean and divide by standard deviation.
Range all columns of df such that the minimum value in each column is 0 and max is 1.
Talk to our AI Counsellors and Practitioners.We'll help you clear all your questions for your background and goals, bridging the gap between your current skills and a career in AI.
10-digit mobile number
⚠️ Please tick the consent box to proceed.
📞
Thank You!
We'll Call You Soon!
Our learning advisor will reach out within 24 hours. (Check your inbox too — we've sent a confirmation)
⚡ Before you go
Python. SQL. NumPy. All free.
Get the exact 10-course programming foundation that Data Science professionals use.
🐍
Core Python — from first line to expert level
📈
NumPy & Pandas — the #1 libraries every DS job needs
🗃️
SQL Levels I–III — basics to Window Functions
📄
Real industry data — Jupyter notebooks included
RAMSK
57,000+ students ★★★★★ Rated 4.9/5
⚡ Before you go
Python. SQL. All Free.
RAMSK
57,000+ students★★★★★ 4.9/5
Get Free Access Now
10 courses. Real projects. Zero cost. No credit card.
New learners enrolling right now
🔒 100% free☕ No spam, ever✓ Instant access
🚀
You're in!
Check your inbox for your access link. (Check Promotions or Spam if you don't see it) Or start your first course right now:

 101 Python datatable Exercises (pydatatable). Photo by Jet Kim.